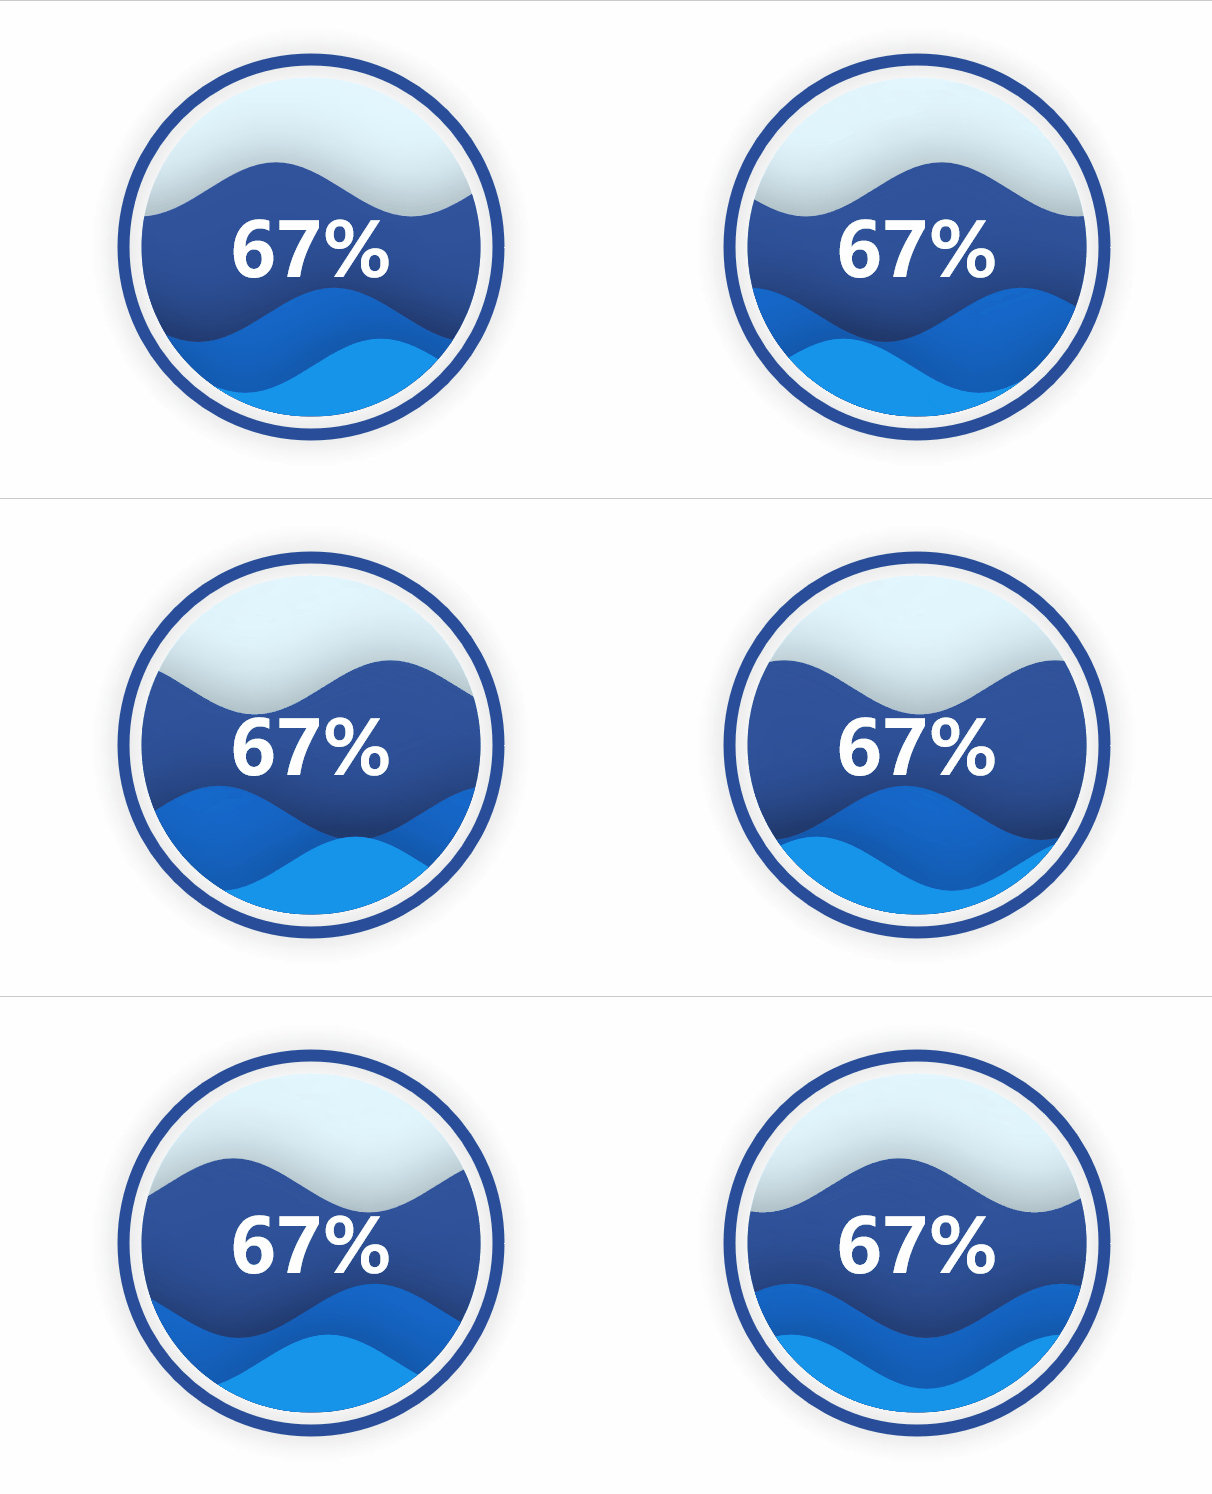
15 pyecharts水球图
from pyecharts import options as opts
from pyecharts.charts import Liquid, Page
from pyecharts.globals import SymbolType

def liquid() -> Liquid:
    c = (
        Liquid()
        .add("lq", [0.67, 0.30, 0.15])
        .set_global_opts(title_opts=opts.TitleOpts(title="Liquid"))
    )
    return c

liquid().render('../../img/liquid.html')
水球图的取值[0.67, 0.30, 0.15]表示下图中的三个波浪线,一般代表三个百分比:
