8 matplotlib柱状图
对应代码:
import numpy as np
import matplotlib.pyplot as plt
import example_utils
def main():
fig, axes = example_utils.setup_axes()
basic_bar(axes[0])
tornado(axes[1])
general(axes[2])
# example_utils.title(fig, '"ax.bar(...)": Plot rectangles')
fig.savefig('bar_example.png', facecolor='none')
plt.show()
# 子图1
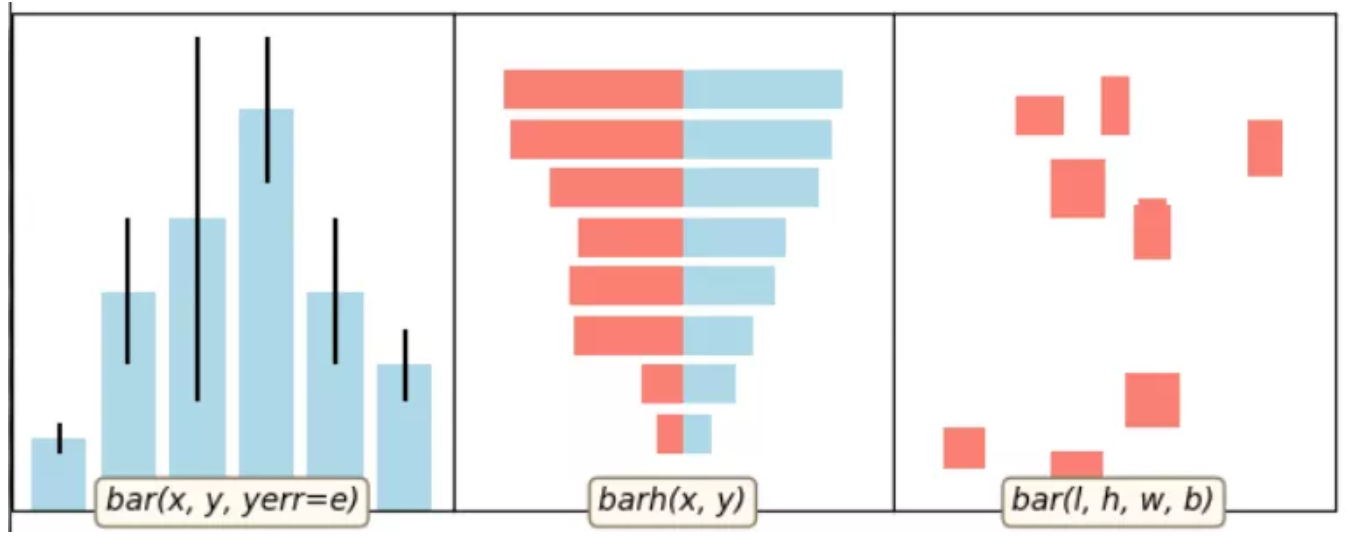
def basic_bar(ax):
y = [1, 3, 4, 5.5, 3, 2]
err = [0.2, 1, 2.5, 1, 1, 0.5]
x = np.arange(len(y))
ax.bar(x, y, yerr=err, color='lightblue', ecolor='black')
ax.margins(0.05)
ax.set_ylim(bottom=0)
example_utils.label(ax, 'bar(x, y, yerr=e)')
# 子图2
def tornado(ax):
y = np.arange(8)
x1 = y + np.random.random(8) + 1
x2 = y + 3 * np.random.random(8) + 1
ax.barh(y, x1, color='lightblue')
ax.barh(y, -x2, color='salmon')
ax.margins(0.15)
example_utils.label(ax, 'barh(x, y)')
# 子图3
def general(ax):
num = 10
left = np.random.randint(0, 10, num)
bottom = np.random.randint(0, 10, num)
width = np.random.random(num) + 0.5
height = np.random.random(num) + 0.5
ax.bar(left, height, width, bottom, color='salmon')
ax.margins(0.15)
example_utils.label(ax, 'bar(l, h, w, b)')
main()