4 plotly画柱状图和折线图
#柱状图+折线图
import plotly.graph_objects as go
fig = go.Figure()
fig.add_trace(
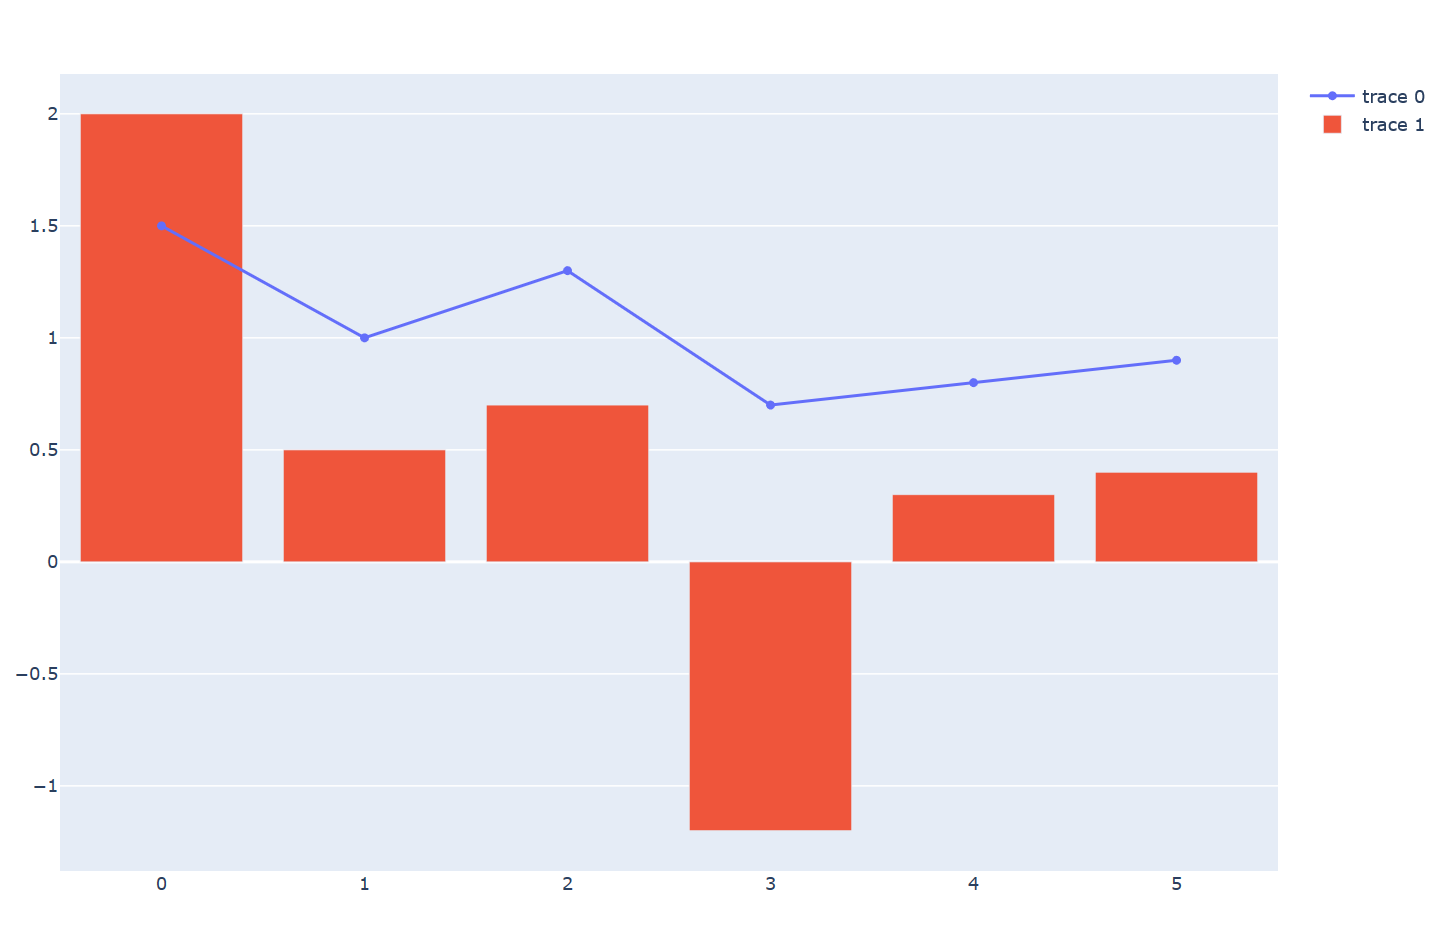
go.Scatter(
x=[0, 1, 2, 3, 4, 5],
y=[1.5, 1, 1.3, 0.7, 0.8, 0.9]
))
fig.add_trace(
go.Bar(
x=[0, 1, 2, 3, 4, 5],
y=[2, 0.5, 0.7, -1.2, 0.3, 0.4]
))
fig.show()